Free Access
Fig. 2
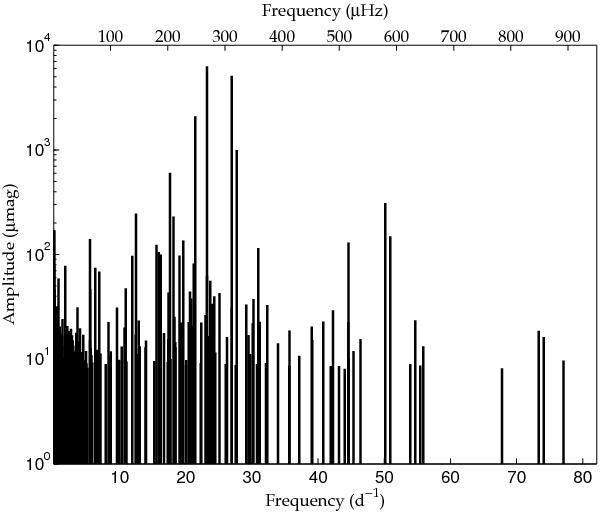
Bar plot of the 185 frequencies extracted from the CoRoT light curve of HD 174966. The amplitude axis is in logarithmic scale and μmag units, and the frequency is shown in μHz and d-1 units.
Current usage metrics show cumulative count of Article Views (full-text article views including HTML views, PDF and ePub downloads, according to the available data) and Abstracts Views on Vision4Press platform.
Data correspond to usage on the plateform after 2015. The current usage metrics is available 48-96 hours after online publication and is updated daily on week days.
Initial download of the metrics may take a while.