Fig. 7
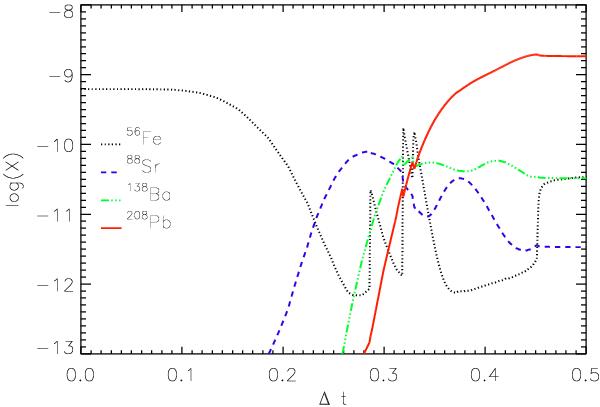
Evolution of the mass fraction of isotopes representative of the three s-process
abundance peaks and  as a function
of time. These abundances were sampled at the position 0.4
M⊙. They are representative of the entire convective
zone and, after the splitting, are located in the HCZ which later comes into contact
with the stellar envelope. The peaks, most noticeable for
, result from
episodic advance of the outer convective boundary due to limitations in the time and
spatial resolution.
as a function
of time. These abundances were sampled at the position 0.4
M⊙. They are representative of the entire convective
zone and, after the splitting, are located in the HCZ which later comes into contact
with the stellar envelope. The peaks, most noticeable for
, result from
episodic advance of the outer convective boundary due to limitations in the time and
spatial resolution.
Current usage metrics show cumulative count of Article Views (full-text article views including HTML views, PDF and ePub downloads, according to the available data) and Abstracts Views on Vision4Press platform.
Data correspond to usage on the plateform after 2015. The current usage metrics is available 48-96 hours after online publication and is updated daily on week days.
Initial download of the metrics may take a while.