Fig. 2
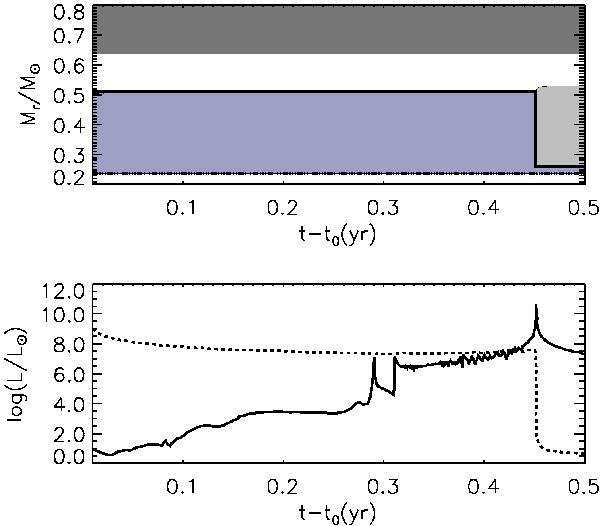
Upper panel: time evolution of convective zones in model M2 Z = 10-8 during the PIE. Dark grey area: convective envelope, purple area between 0.24 and 0.51 M⊙: HeCZ; light grey area: HCZ. Thick solid line represents the position where hydrogen mass fraction is 0.001; dot-dashed line represents the position of maximum energy release due to He-burning, respectively. The splitting of the HeCZ around t − t0 = 0.451 yr is evident with the formation of the detached HCZ. Bottom panel: evolution of H-burning (solid line) and He-burning (dashed line) luminosities. t = t0 corresponds to the time of maximum He-burning luminosity.
Current usage metrics show cumulative count of Article Views (full-text article views including HTML views, PDF and ePub downloads, according to the available data) and Abstracts Views on Vision4Press platform.
Data correspond to usage on the plateform after 2015. The current usage metrics is available 48-96 hours after online publication and is updated daily on week days.
Initial download of the metrics may take a while.