Fig. 1
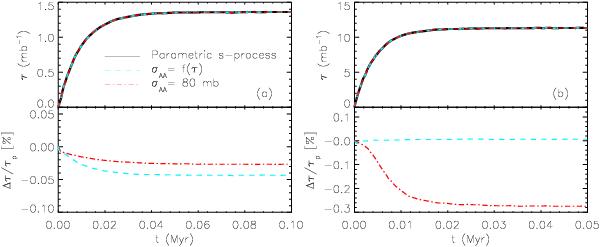
Top panels: time evolution of the neutron exposure for the
parametrized s-process calculation and the neutron sink approach with different
cross-section values for a composition of heavy elements
(A > 30), corresponding to a solar
abundance pattern scaled down to Z = 10-8. The abundance
values for light elements (A < 30) were
taken from stellar models calculated using GARSTEC except for
 , where
we take two different values. Panel a) shows results for a
mass-fraction of 10-4 and panel b) for a
mass-fraction of 10-2. In both cases, lines depicting results for the
full network (black line) and a sink element (cyan and red lines) overlap. To
enhance differences for each value of the
abundance, we show the relative difference in percentage of the neutron exposure
with respect to the neutron exposure from the parametric calculations
(τp) overlapped in both plots.
, where
we take two different values. Panel a) shows results for a
mass-fraction of 10-4 and panel b) for a
mass-fraction of 10-2. In both cases, lines depicting results for the
full network (black line) and a sink element (cyan and red lines) overlap. To
enhance differences for each value of the
abundance, we show the relative difference in percentage of the neutron exposure
with respect to the neutron exposure from the parametric calculations
(τp) overlapped in both plots.
Current usage metrics show cumulative count of Article Views (full-text article views including HTML views, PDF and ePub downloads, according to the available data) and Abstracts Views on Vision4Press platform.
Data correspond to usage on the plateform after 2015. The current usage metrics is available 48-96 hours after online publication and is updated daily on week days.
Initial download of the metrics may take a while.