Fig. 2
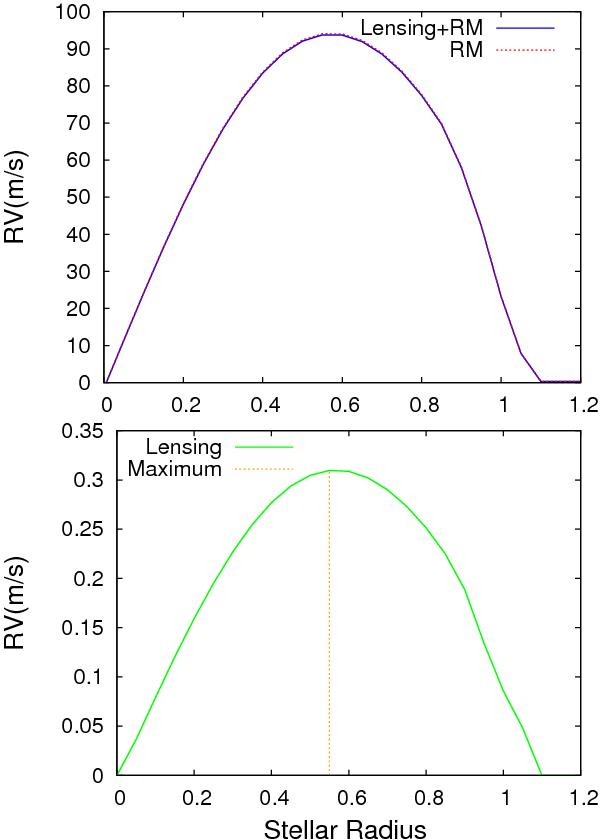
Top: graphs of the RM effect with and without the contribution of the planet’s microlensing. Note that the two curves are almost overlaying each other. To remove the effect of microlensing, we assume RE = 0. Bottom: graphs of residuals between the two curves shown in the top panel. The residuals demonstrate the net behavior of microlensing as a function of the planet’s position along the stellar radius. The maximum value of the of microlensing appears at 0.55 stellar radii.
Current usage metrics show cumulative count of Article Views (full-text article views including HTML views, PDF and ePub downloads, according to the available data) and Abstracts Views on Vision4Press platform.
Data correspond to usage on the plateform after 2015. The current usage metrics is available 48-96 hours after online publication and is updated daily on week days.
Initial download of the metrics may take a while.