Fig. 7
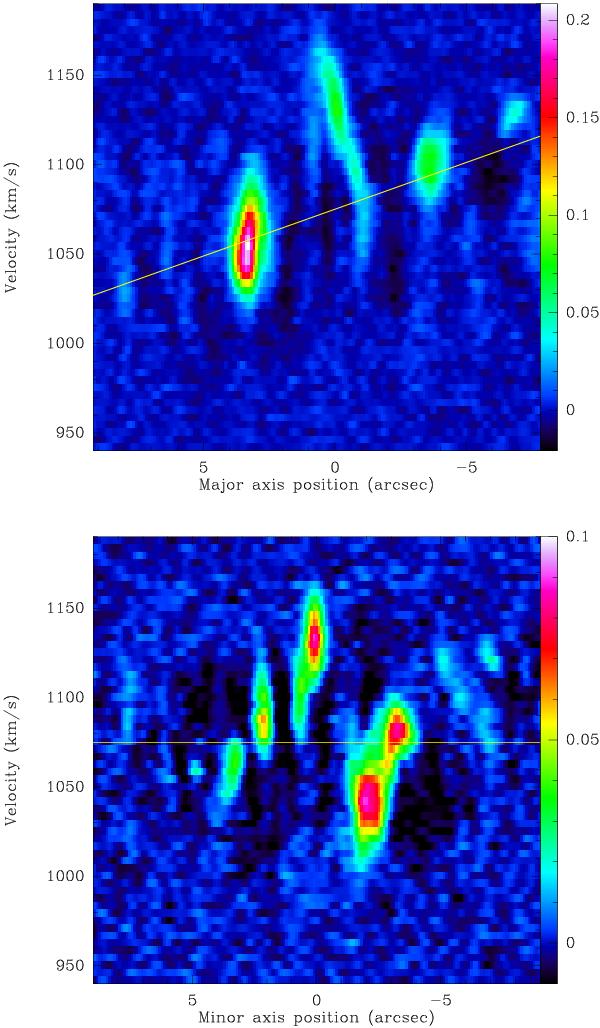
Top: position–velocity diagram along the major axis of PA = 199° (east is at left). The central outflow is clearly visible superposed on the smooth rotational velocity gradient (underlined by the yellow line, corresponding to the rotation curve of Fig. 6). Bottom: position–velocity diagram, along the minor axis, of PA = 109° (east is at left). The two components (red and blue) of the outflow are visible, along a slice, where the velocity should be equal to the systemic one (yellow line).
Current usage metrics show cumulative count of Article Views (full-text article views including HTML views, PDF and ePub downloads, according to the available data) and Abstracts Views on Vision4Press platform.
Data correspond to usage on the plateform after 2015. The current usage metrics is available 48-96 hours after online publication and is updated daily on week days.
Initial download of the metrics may take a while.