Fig. 3
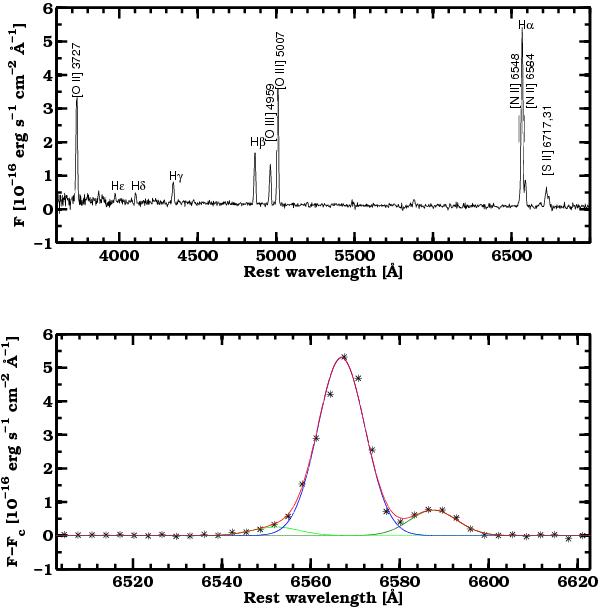
(Top panel) An example of a bright H ii region spectrum (in UGC 6510), where we identify the strongest detected lines. (Bottom panel) The continuum subtracted Hα and [N ii] lines are shown along with the multiple Gaussian fit that allows us to deblend the three different features and to measure their fluxes. In red we indicate the total fit. In bright green, dark green and blue we show the single components fitting [N ii] λ6548, [N ii] λ6584, and Hα, respectively. The difference in wavelength between the centroids of each line are fixed, a single FWHM is used and the [N ii] λ6584 to [N ii] λ6548 flux ratio is fixed to 3.
Current usage metrics show cumulative count of Article Views (full-text article views including HTML views, PDF and ePub downloads, according to the available data) and Abstracts Views on Vision4Press platform.
Data correspond to usage on the plateform after 2015. The current usage metrics is available 48-96 hours after online publication and is updated daily on week days.
Initial download of the metrics may take a while.