Fig. 6
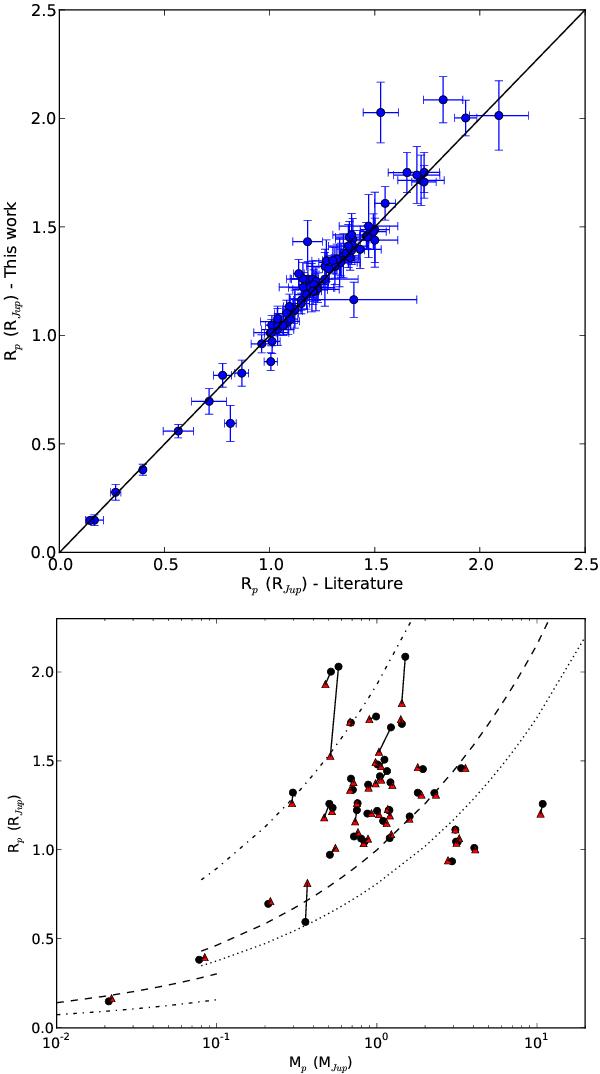
Top panel: comparison of the planetary radii, calculated with our photometric stellar radius, with literature values. Bottom panel: planetary radii are plotted against their masses. Circles denote the values calculated with the stellar radius and mass from this work, using the photometric surface gravity, while the triangles are the values from the homogenous TEPCat Catalogue. Isodensity curves are overplotted for Saturn (dash-dotted), Jupiter (dashed), Neptune (dotted), Mars (dash-dotted), and Pluto (dashed).
Current usage metrics show cumulative count of Article Views (full-text article views including HTML views, PDF and ePub downloads, according to the available data) and Abstracts Views on Vision4Press platform.
Data correspond to usage on the plateform after 2015. The current usage metrics is available 48-96 hours after online publication and is updated daily on week days.
Initial download of the metrics may take a while.