Fig. 9
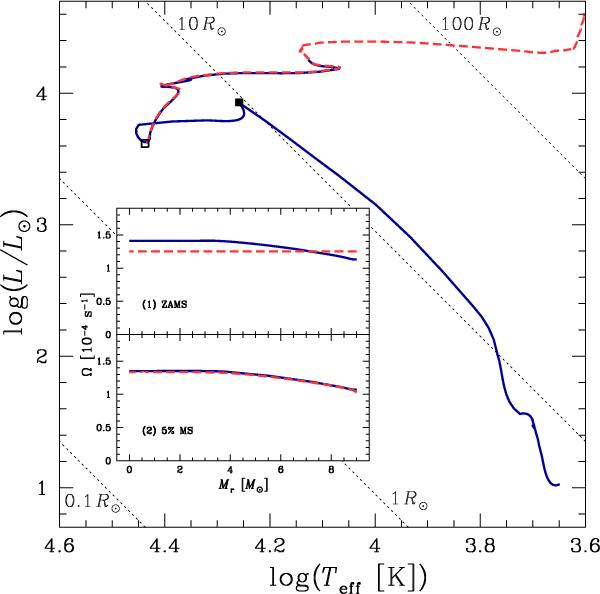
Evolution of a rotating 9 M⊙ model at Z = 0.002 computed with a fully-consistent PMS evolution with accretion (blue solid line), compared to the track of the corresponding model of the present work (started on the ZAMS with a flat rotational profile, red dashed line). The black square shows the point where the accretion is stopped. The open square indicates the ZAMS. The dotted lines are isoradius lines. The inserted panel compares the Ω-profile as a function of the Lagrangian mass inside the two models on the ZAMS (top) and after 5% of the MS (bottom).
Current usage metrics show cumulative count of Article Views (full-text article views including HTML views, PDF and ePub downloads, according to the available data) and Abstracts Views on Vision4Press platform.
Data correspond to usage on the plateform after 2015. The current usage metrics is available 48-96 hours after online publication and is updated daily on week days.
Initial download of the metrics may take a while.