Fig. 8
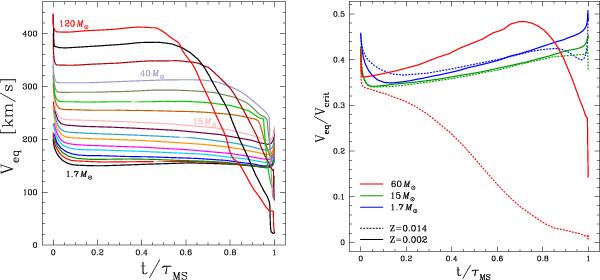
Evolution of rotation on the MS as a function of the central mass fraction of hydrogen for all the stellar models from 1.7 to 120 M⊙. Left: evolution of the equatorial velocity. The curve for the 1.7 M⊙ is the bottom black line at the beginning of the evolution, and that for the 120 M⊙ the upper red line (increasing initial equatorial velocity for increasing mass). Right: evolution of the Veq/Vcrit ratio for models with Mini = 1.7, 15, and 60 M⊙ at two different metallicities.
Current usage metrics show cumulative count of Article Views (full-text article views including HTML views, PDF and ePub downloads, according to the available data) and Abstracts Views on Vision4Press platform.
Data correspond to usage on the plateform after 2015. The current usage metrics is available 48-96 hours after online publication and is updated daily on week days.
Initial download of the metrics may take a while.