Fig. 15
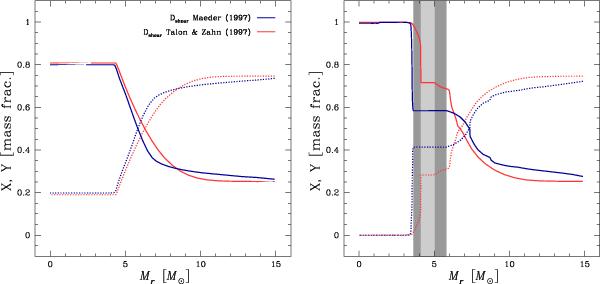
Profiles of hydrogen (in mass fraction, dotted lines) and of helium (solid lines) as a function of the Lagrangian mass coordinate inside a 15 M⊙ model at Z = 0.002 with Vini/Vcrit = 0.50 for different prescriptions for the Dshear (blue: M97; red: TZ97. Left: profiles in the last third of the MS phase. Right: just after the MS phase, when  . The shaded areas represent the extension of the convective zone associated to the H-burning shell (dark grey: M97 model; light grey: TZ97 model).
Current usage metrics show cumulative count of Article Views (full-text article views including HTML views, PDF and ePub downloads, according to the available data) and Abstracts Views on Vision4Press platform.
Data correspond to usage on the plateform after 2015. The current usage metrics is available 48-96 hours after online publication and is updated daily on week days.
Initial download of the metrics may take a while.