Fig. 13
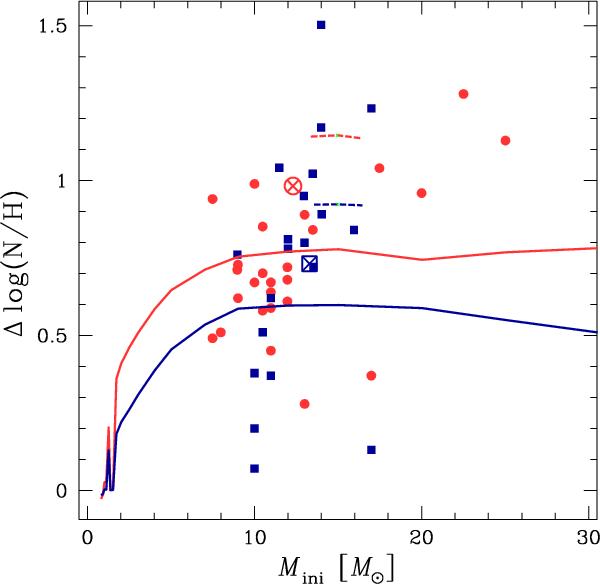
Variation of the nitrogen enrichment as a function of the initial mass for the present rotating models (blue solid line: middle of the MS; red solid line: end of the MS). The short dashed lines show the value of Δlog (N/H) for a 15 M⊙ model when initial abundances for the SMC are used (see text). The observational points are from the same stars as in Fig. 12. The big cross in square (circle) shows the mean observed values for the MS (post-MS) stars. The error bars on the values of Δlog (N/H) are between 0.2 and 0.3 dex (see Table 2 in Hunter et al. 2009).
Current usage metrics show cumulative count of Article Views (full-text article views including HTML views, PDF and ePub downloads, according to the available data) and Abstracts Views on Vision4Press platform.
Data correspond to usage on the plateform after 2015. The current usage metrics is available 48-96 hours after online publication and is updated daily on week days.
Initial download of the metrics may take a while.