Fig. 12
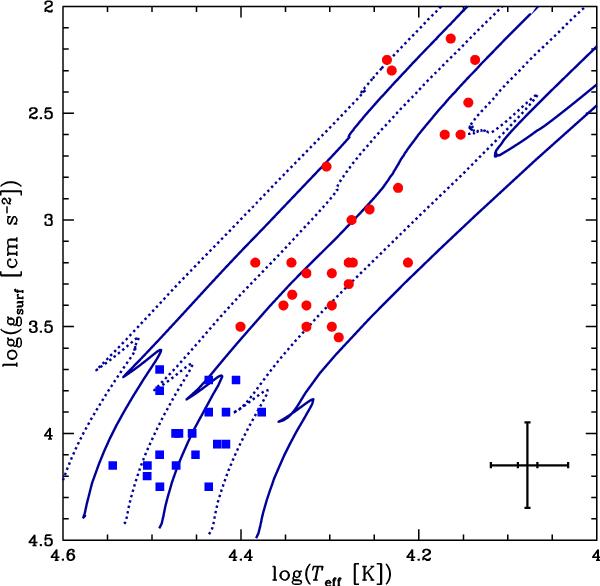
Evolutionary tracks in the log (g) vs.  plane for the 7, 9, 12, 15, 20, and 25 M⊙ rotating models (from right to left) at Z = 0.002. The observational points are SMC stars observed by Hunter et al. (2007; blue squares: MS stars; red circles: post-MS stars). Typical errorbars are indicated on the bottom-right corner: 0.2 dex in gsurf and 1000 K in Teff (corresponding to the smallest error shown at log (Teff) = 4.6 and to the biggest one at log (Teff) = 4.0.
Current usage metrics show cumulative count of Article Views (full-text article views including HTML views, PDF and ePub downloads, according to the available data) and Abstracts Views on Vision4Press platform.
Data correspond to usage on the plateform after 2015. The current usage metrics is available 48-96 hours after online publication and is updated daily on week days.
Initial download of the metrics may take a while.