Fig. 10
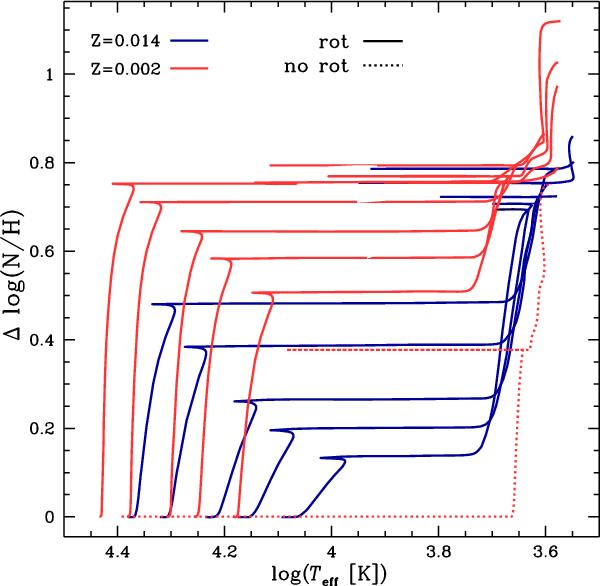
Evolutionary tracks in the Δlog (N/H) vs.  plane, with Δ(N/H) = log (N/H)t − log (N/H)ini, where (N/H)t is the ratio of the nitrogen to hydrogen abundance (in number) at the surface of the star at the time t. The tracks are from models with Mini = 3, 4, 5, 7, and 9 M⊙ (from right to left). The solid red lines are for the models at Z = 0.002 and the solid blue lines correspond to the models at Z = 0.014 from Paper I. The dotted red line correspond to the non-rotating 7 M⊙ model at Z = 0.002.
Current usage metrics show cumulative count of Article Views (full-text article views including HTML views, PDF and ePub downloads, according to the available data) and Abstracts Views on Vision4Press platform.
Data correspond to usage on the plateform after 2015. The current usage metrics is available 48-96 hours after online publication and is updated daily on week days.
Initial download of the metrics may take a while.