Fig. 4
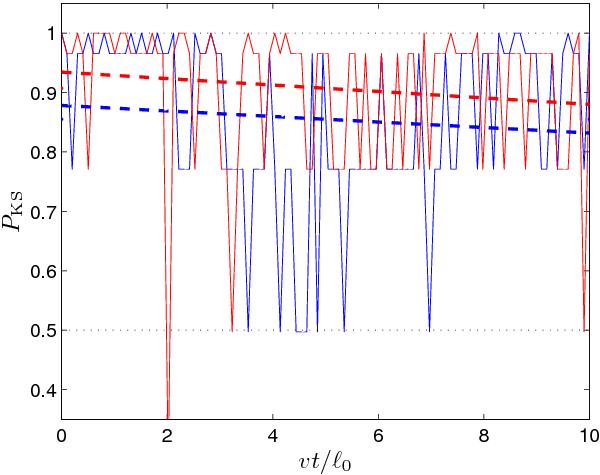
Time evolution of the KS test statistic (solid lines) for the agreement between the pitch-angle distribution, f(μ,t), and the initial distribution, f(μ0,0) (which are obtained from uniform random deviates) together with linear fits (dashed lines). The red and blue lines correspond to the cases of low and intermediate turbulence strength, respectively. (This figure is available in color in electronic form)
Current usage metrics show cumulative count of Article Views (full-text article views including HTML views, PDF and ePub downloads, according to the available data) and Abstracts Views on Vision4Press platform.
Data correspond to usage on the plateform after 2015. The current usage metrics is available 48-96 hours after online publication and is updated daily on week days.
Initial download of the metrics may take a while.