Fig. 14
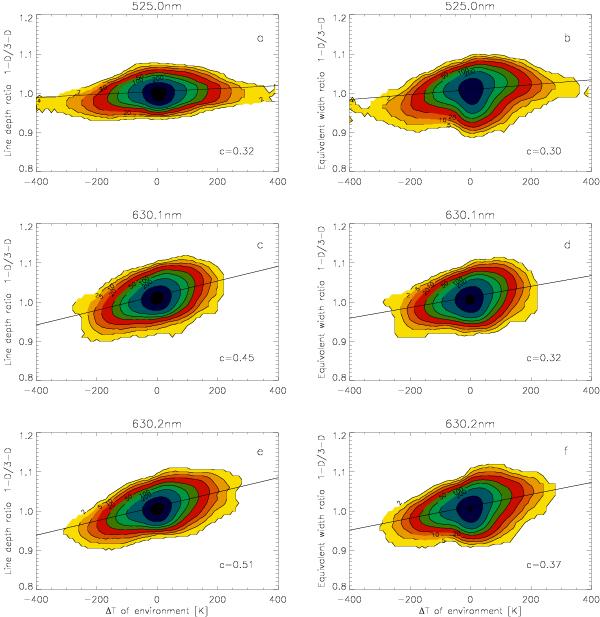
Line depth ratio D1 - D NLTE/D3 - D NLTE (left panels) and analogous ratio of equivalent width (right panels) as a function of the temperature difference to the local environment for all (x,y) positions of the hydrodynamic data cube. The point density is indicated by the colored shading in a logarithmic scale (yellow: 2, orange: 5, dark orange: 10, red: 20, etc. up to the innermost area in black with 1000+). The unit area was defined by subdividing the temperature axis into sections of 10 K and that of the EW ratio into sections 0.01. Regression lines are over-plotted and the corresponding correlation coefficients are given in the lower right corner of each frame.
Current usage metrics show cumulative count of Article Views (full-text article views including HTML views, PDF and ePub downloads, according to the available data) and Abstracts Views on Vision4Press platform.
Data correspond to usage on the plateform after 2015. The current usage metrics is available 48-96 hours after online publication and is updated daily on week days.
Initial download of the metrics may take a while.