Fig. 5
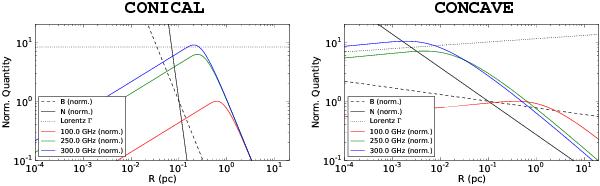
Quantities derived from our simplified jet model. The magnetic field B and electron density N (dashed and solid black lines) are shown as a function of radial distance from the jet origin, normalized to their values at 10-1 pc; the Lorentz factor, Γ, (dotted line) is shown unnormalized; the jet brightness at 100, 250, and 300 GHz (blue, green, and red lines) is shown normalized to the brightness peak at 100 GHz. Left, a fitting model obtained assuming that the emission comes from the conical (i.e., free) jet region. Right, a fitting model assuming that the emission comes from the concave jet region. See text for details.
Current usage metrics show cumulative count of Article Views (full-text article views including HTML views, PDF and ePub downloads, according to the available data) and Abstracts Views on Vision4Press platform.
Data correspond to usage on the plateform after 2015. The current usage metrics is available 48-96 hours after online publication and is updated daily on week days.
Initial download of the metrics may take a while.