Free Access
Fig. 11
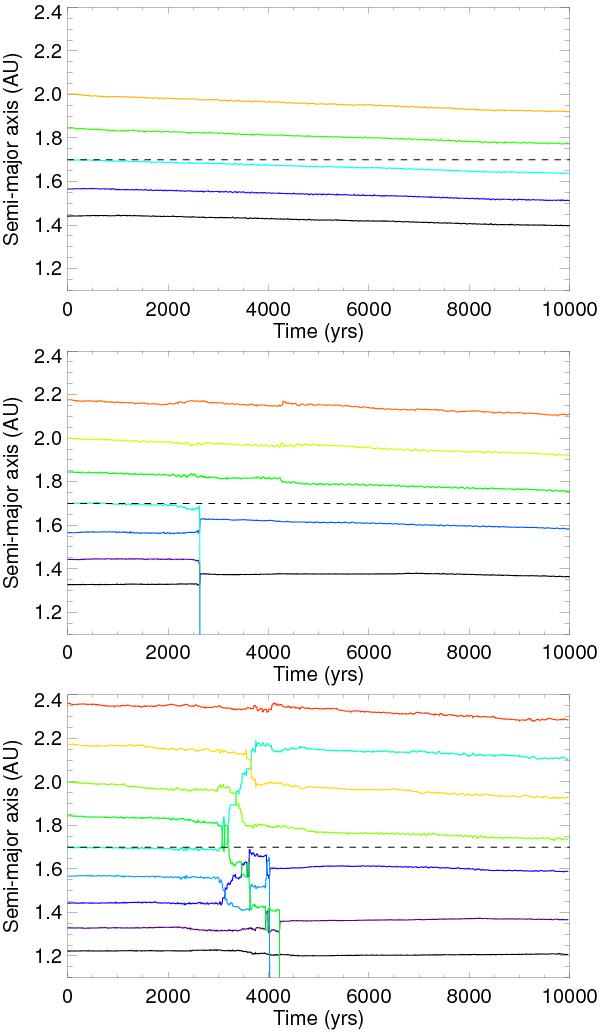
Top panel: time evolution of the semimajor-axes of protoplanets in a hydrodynamical simulation with N = 5 and with stochastic forces included. Middle panel: same but for N = 7. Bottom panel: same but for N = 9. The dashed line shows the location of the zero-migration line.
This figure is made of several images, please see below:
Current usage metrics show cumulative count of Article Views (full-text article views including HTML views, PDF and ePub downloads, according to the available data) and Abstracts Views on Vision4Press platform.
Data correspond to usage on the plateform after 2015. The current usage metrics is available 48-96 hours after online publication and is updated daily on week days.
Initial download of the metrics may take a while.