Free Access
Fig. 8
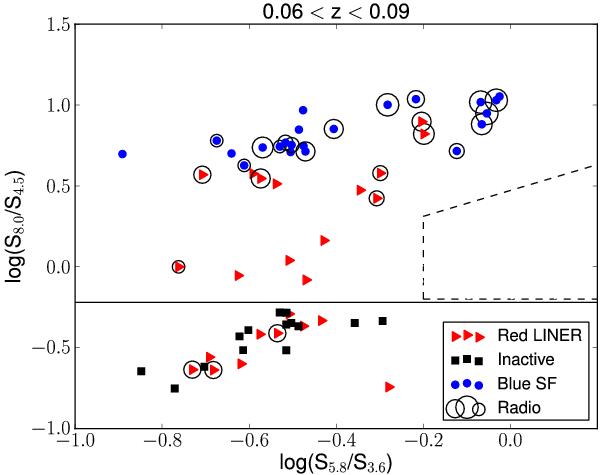
Infrared color–color plot in the highest redshift bin for galaxies with Spitzer detection (22 blue SF, 24 red LINER and 14 inactive galaxies). Circles are proportional to the radio power distribution. The dashed line indicates the region for powerful AGN.
Current usage metrics show cumulative count of Article Views (full-text article views including HTML views, PDF and ePub downloads, according to the available data) and Abstracts Views on Vision4Press platform.
Data correspond to usage on the plateform after 2015. The current usage metrics is available 48-96 hours after online publication and is updated daily on week days.
Initial download of the metrics may take a while.