Fig. 3
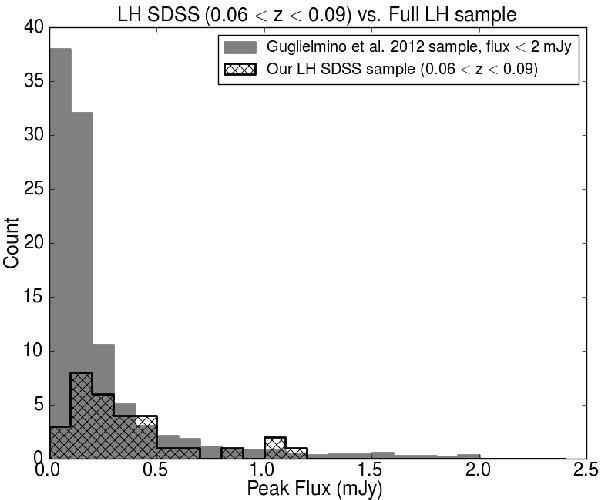
Flux distribution of the highest redshift radio sample used in this study (black hatched region, i.e. 31 radio sources with available SDSS redshift) compared to the distribution of the entire radio sample in the Lockman Hole (grey area, Guglielmino et al. 2012). For the Guglielmino et al. (2012) sample, sources with larger fluxes are also found, however here we only plot sources with peak flux <2 mJy, in order to match the distribution of sources in this study. The latter distribution is normalized by the total number of galaxies (below 2 mJy) detected in the catalog of Guglielmino et al. 2012. The radio power corresponding to the fluxes is log(P1.4 GHz) < 22.5 W Hz-1.
Current usage metrics show cumulative count of Article Views (full-text article views including HTML views, PDF and ePub downloads, according to the available data) and Abstracts Views on Vision4Press platform.
Data correspond to usage on the plateform after 2015. The current usage metrics is available 48-96 hours after online publication and is updated daily on week days.
Initial download of the metrics may take a while.