Fig. 9
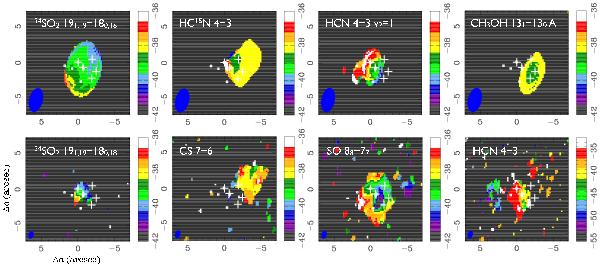
First moment maps of different molecules observed toward W3 IRS5. The upper four maps are derived from the compact-configuration dataset with natural weighting, while the bottom four maps are made from the combined dataset using uniform weighting. The markers are identical to the ones in Fig. 1. The zero position is the phase center. We note that the velocity ranges are the same for all maps except HCN 4–3.
Current usage metrics show cumulative count of Article Views (full-text article views including HTML views, PDF and ePub downloads, according to the available data) and Abstracts Views on Vision4Press platform.
Data correspond to usage on the plateform after 2015. The current usage metrics is available 48-96 hours after online publication and is updated daily on week days.
Initial download of the metrics may take a while.