Fig. 4
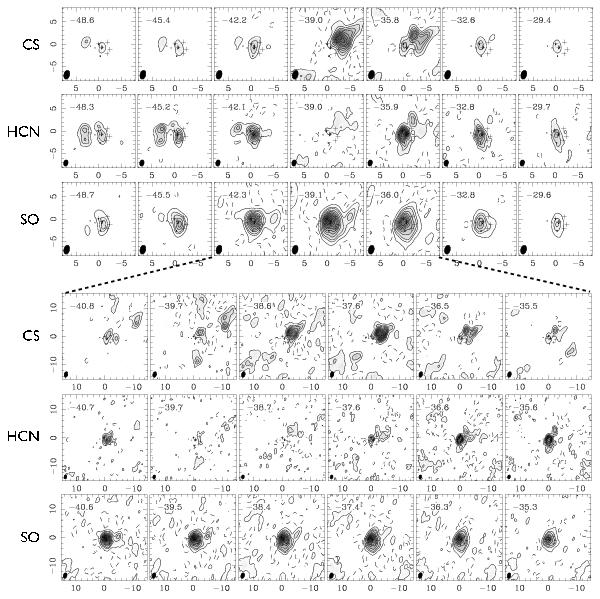
Velocity channel maps of CS J = 7–6, SO NJ = 88–77 and HCN J = 4–3 toward W3 IRS5. Robust weighting (robust = 0) is used for the imaging, resulting resolutions of  , PA − 15°,
  , PA − 13°, and , PA − 14°, for CS, HCN and SO, respectively. The x- and y-axes are RA offset and Dec offset relative to the phase center α(2000) = 02h25m40
 78,
78,  50 in arcseconds, respectively. The upper three rows shows the velocity range between − 49 km s-1 to − 30 km s-1. The lower three rows show a narrower velocity range from − 41 km s-1 to − 35 km s-1. The markers are identical to Fig. 2. Solid and dashed contours represent positive and negative intensities, respectively. The absolute contour levels for CS in the upper panel are 3, 8, 13,... σ (1σ = 0.11 Jy beam-1). The absolute contour levels for HCN in the upper panel are 3, 8, 13,... σ (1σ = 0.12 Jy beam-1). The absolute contour levels for SO in the upper panel are 3, 13, 23, 43, 63... σ (1σ = 0.11 Jy beam-1). The absolute contour levels for CS in the lower panel are 3, 8, 13,... σ (1σ = 0.18 Jy beam-1). The absolute contour levels for HCN in the lower panel are 3, 7, 11,... σ (1σ = 0.16 Jy beam-1). The absolute contour levels for SO in the lower panel are 3, 13, 23, 43, 63,... σ (1σ = 0.14 Jy beam-1).
Current usage metrics show cumulative count of Article Views (full-text article views including HTML views, PDF and ePub downloads, according to the available data) and Abstracts Views on Vision4Press platform.
Data correspond to usage on the plateform after 2015. The current usage metrics is available 48-96 hours after online publication and is updated daily on week days.
Initial download of the metrics may take a while.