Fig. 2
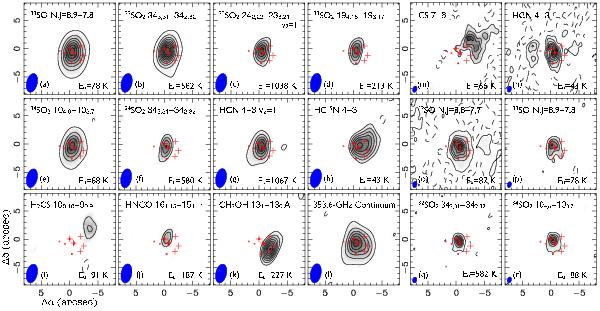
Moment 0 maps of molecular emission toward W3 IRS5. The 353.6-GHz continuum emission is also presented for comparison. In panels a) to l), the compact dataset is imaged using natural weighting, resulting in a resolution of  , (PA − 12°) shown as the filled ellipse in the bottom-left corner of each panel. In panels m) to r), the combined dataset is imaged using uniform weighting, resulting in a resolution of
  (PA − 17°). The five crosses represent the positions of SMM1 to SMM5 (cf. Fig. 1). Open squares are the positions of IR sources taken from Megeath et al. (2005), while filled circles are the positions of cm-wave sources reported by van der Tak et al. (2005). The (0, 0) position corresponds to the reference phase center (Sect. 2). In all panels, contour levels start at 3σ (solid line) and −3σ (dashed line). The contour units are Jy beam-1 km s-1 for panel a)–k) and m)–r), and Jy beam-1 for panel l). The 1-σ noise levels from a) to r) are 1.0, 0.9, 0.35, 0.39, 0.72, 0.46, 1.0, 0.45, 0.22, 0.45, 0.36, 0.04, 0.47, 0.94, 0.66, 0.68, 0.84 and 0.68 respectively. The contour steps from a) to r) are 10, 10, 2, 2, 10, 2, 4, 2, 1, 1, 2, 4, 4, 5, 20, 5, 6 and 5, respectively.
Current usage metrics show cumulative count of Article Views (full-text article views including HTML views, PDF and ePub downloads, according to the available data) and Abstracts Views on Vision4Press platform.
Data correspond to usage on the plateform after 2015. The current usage metrics is available 48-96 hours after online publication and is updated daily on week days.
Initial download of the metrics may take a while.