Fig. 12
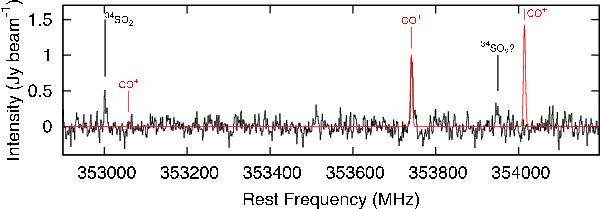
Hanning-smoothed spectrum taken from the compact-configuration dataset toward zone A (offset position: − 0.42″, − 0.43″). The black lines are the observed data, while the red lines are the model spectrum of CO+N = 3–2, F = 3/2–1/2 (353.0589 GHz), 5/2–3/2 (353.7413 GMHz) and 7/2–5/2 (354.0142 GHz) under LTE assumption. The LTE intensity ratio of the hyperfine transitions is ~1:14:20 (increasing in frequency). The F = 7/2–5/2 transition at 354.0142 GHz is not detected in our SMA data.
Current usage metrics show cumulative count of Article Views (full-text article views including HTML views, PDF and ePub downloads, according to the available data) and Abstracts Views on Vision4Press platform.
Data correspond to usage on the plateform after 2015. The current usage metrics is available 48-96 hours after online publication and is updated daily on week days.
Initial download of the metrics may take a while.