Fig. 11
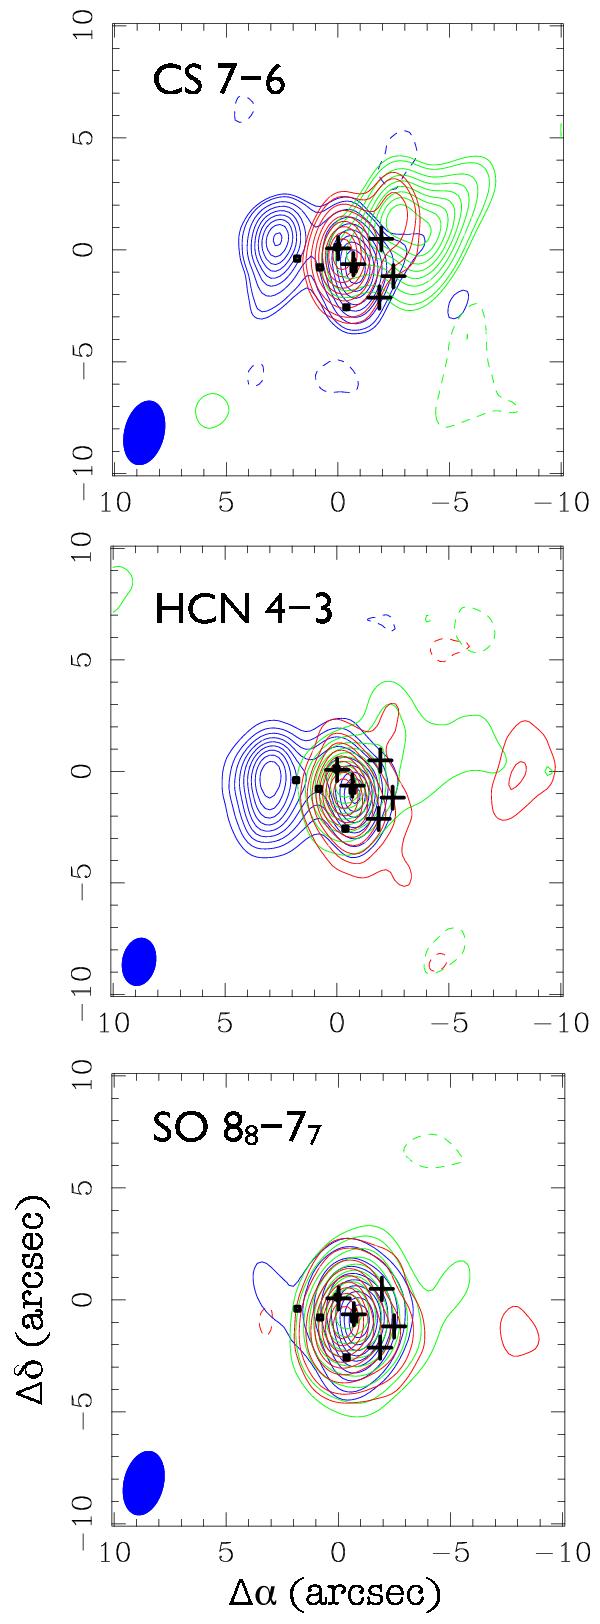
Integrated intensity maps at different velocity ranges (blue: −50 to −43 km s-1; green: −43 to −35 km s-1; red: −35 to −28 km s-1). We adopted the combined-configuration dataset in natural weighting in order to show the additional weak emission features. The contour levels of each Doppler-shifted component for CS, HCN and SO are 15, 20, 30, 40,...%, 10, 20, 30,...% and 5, 10, 20, 30,...% of the emission peak, respectively. We note that the first contours are all ≥3σ noise level. The markers are identical to the ones in Fig. 1.
Current usage metrics show cumulative count of Article Views (full-text article views including HTML views, PDF and ePub downloads, according to the available data) and Abstracts Views on Vision4Press platform.
Data correspond to usage on the plateform after 2015. The current usage metrics is available 48-96 hours after online publication and is updated daily on week days.
Initial download of the metrics may take a while.