Fig. 1
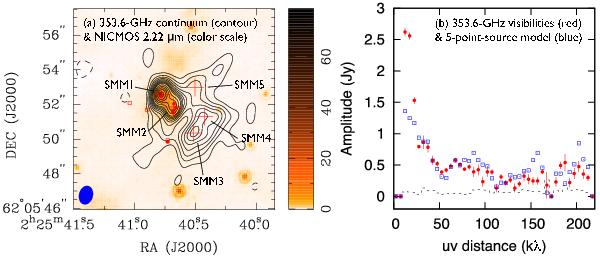
a) Continuum emission of W3 IRS5 region at 353.6 GHz (black contours) overplotted with the NICMOS 2.22 μm emission (color scale). The synthesized beam size is  , PA − 14°. The contour levels are –3, 3, 5, 7, ..., 19, 23, 27, ... σ with 1σ of 10 mJy beam-1. The red crosses mark the positions of the five point sources derived from the visibility fit. The red open squares are the positions of near-infrared sources identified by Megeath et al. (2005) while the red filled circles represent the positions of cm-wave sources from van der Tak et al. (2005). b) Vector-averaged 353.6 GHz continuum visibilities. The red filled circles with error bars are the observed data. The expected zero amplitude is shown as a dashed histogram. The model consisting of five point sources is plotted with open blue squares.
Current usage metrics show cumulative count of Article Views (full-text article views including HTML views, PDF and ePub downloads, according to the available data) and Abstracts Views on Vision4Press platform.
Data correspond to usage on the plateform after 2015. The current usage metrics is available 48-96 hours after online publication and is updated daily on week days.
Initial download of the metrics may take a while.