Fig. 7
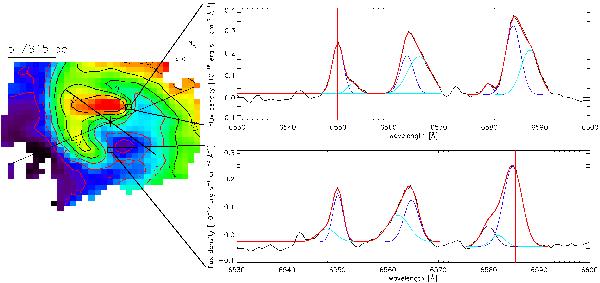
Hα line of sight-velocity map (left) as in Fig. 6. On the right hand side, we display the red grating spectra of the regions highlighted by black boxes in the velocity map. The different components of the attempted line fits are plotted in the spectra as well. In red, the overall fit is displayed. The third (and left-most) fitting component in the [N ii] λ6585 emission line is the fit on the sky line contamination. The fitting results are reported in Table 1. The vertical red lines denote the rest wavelength of the emission line.
Current usage metrics show cumulative count of Article Views (full-text article views including HTML views, PDF and ePub downloads, according to the available data) and Abstracts Views on Vision4Press platform.
Data correspond to usage on the plateform after 2015. The current usage metrics is available 48-96 hours after online publication and is updated daily on week days.
Initial download of the metrics may take a while.