Free Access
Fig. 8
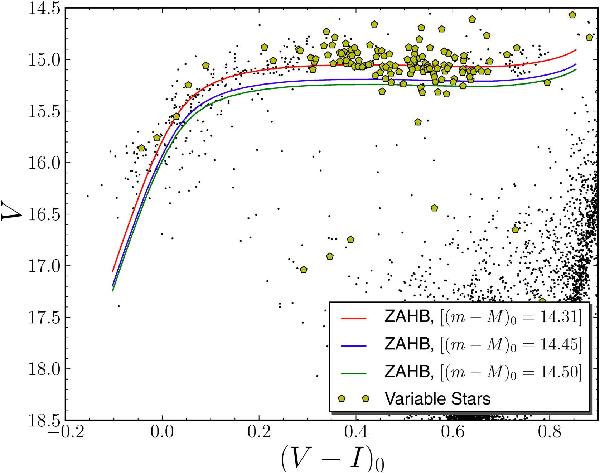
PGPUC ZAHB loci for different assumptions on the distance modulus overplotted on the HB region of M5. Variable stars from the Clement et al. (2001) catalog are plotted in yellow.
Current usage metrics show cumulative count of Article Views (full-text article views including HTML views, PDF and ePub downloads, according to the available data) and Abstracts Views on Vision4Press platform.
Data correspond to usage on the plateform after 2015. The current usage metrics is available 48-96 hours after online publication and is updated daily on week days.
Initial download of the metrics may take a while.