Free Access
Fig. 4
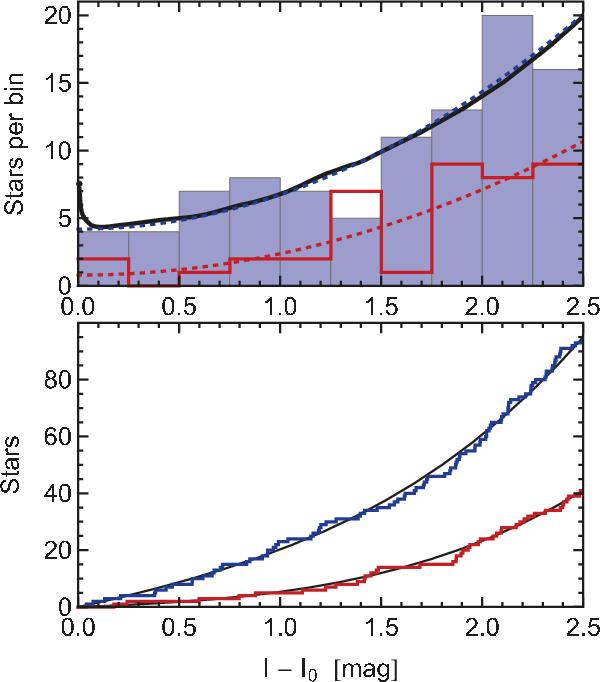
Top: luminosity functions of RGB (filled histogram) and AGB. Thick black line: expectation from evolutionary speed. Dashed lines: fit to data. Bottom: cumulative luminosity function for RGB stars (in blue) and AGB stars (in red) and fit functions for each case.
Current usage metrics show cumulative count of Article Views (full-text article views including HTML views, PDF and ePub downloads, according to the available data) and Abstracts Views on Vision4Press platform.
Data correspond to usage on the plateform after 2015. The current usage metrics is available 48-96 hours after online publication and is updated daily on week days.
Initial download of the metrics may take a while.