Fig. 9
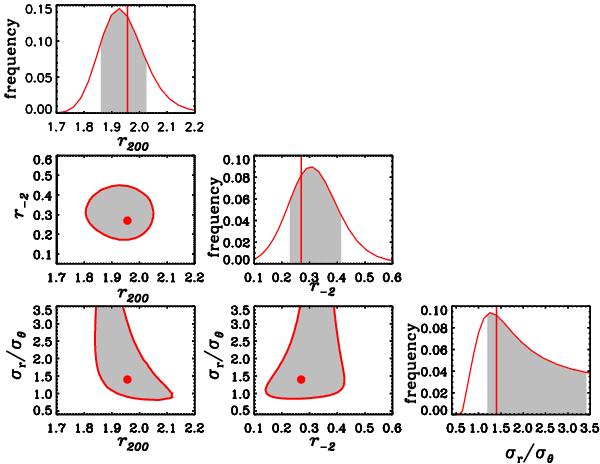
Results of the MAMPOSSt analysis using the NFW and O models for M(r) and β(r), respectively. The vertical lines and dots indicate the best-fit solutions. The likelihood distributions on each parameter are obtained by marginalizing vs. the other two parameters. Gray-shading in the likelihood distribution plots indicate the 1σ confidence regions. The red, gray-shaded contours are 1σ confidence levels on the two labeled parameters, obtained by marginalizing vs. the third parameter. Note that we show results for σr/σθ rather than for β (see Eq. (1)).
Current usage metrics show cumulative count of Article Views (full-text article views including HTML views, PDF and ePub downloads, according to the available data) and Abstracts Views on Vision4Press platform.
Data correspond to usage on the plateform after 2015. The current usage metrics is available 48-96 hours after online publication and is updated daily on week days.
Initial download of the metrics may take a while.