Fig. 6
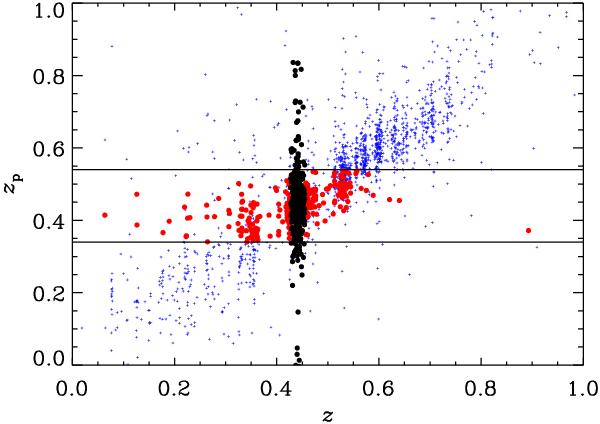
Photometric zp vs. spectroscopic z for the sample of galaxies with z and 18 ≤ mR ≤ 23 in the cluster field. Spectroscopic cluster members are indicated with black dots, galaxies selected within the 0.34 < zp < 0.54 range and within the chosen mR − mI vs. mB − mV color−color cut (see text) are indicated with red (grey) dots. Galaxies outside the photometric and spectroscopic membership selection are indicated with blue crosses.
Current usage metrics show cumulative count of Article Views (full-text article views including HTML views, PDF and ePub downloads, according to the available data) and Abstracts Views on Vision4Press platform.
Data correspond to usage on the plateform after 2015. The current usage metrics is available 48-96 hours after online publication and is updated daily on week days.
Initial download of the metrics may take a while.