Fig. 2
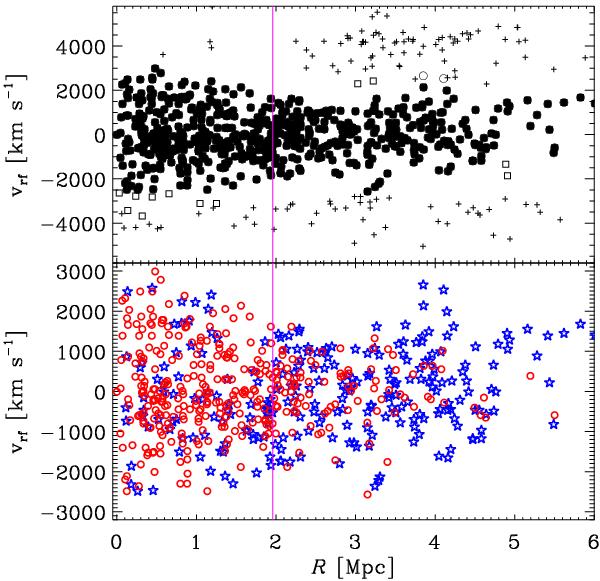
Top panel: galaxies in the projected phase-space diagram, R,vrf. Black dots represent galaxies identified as cluster members by both the P+G and Clean algorithms. Open circles represent galaxies identified as cluster members by the P+G algorithm only. Squares represent galaxies identified as cluster members by the Clean algorithm only. Crosses represent noncluster members. Bottom panel: cluster members selected with the P+G method in the projected phase-space diagram, R,vrf. Red circles represent passive galaxies, blue stars represent SF galaxies. In both panels the vertical (magenta) line indicates r200,U, i.e. the r200 value obtained by scaling the rΔ estimate of U12 at Δ = 200, using their best-fit NFW profile.
Current usage metrics show cumulative count of Article Views (full-text article views including HTML views, PDF and ePub downloads, according to the available data) and Abstracts Views on Vision4Press platform.
Data correspond to usage on the plateform after 2015. The current usage metrics is available 48-96 hours after online publication and is updated daily on week days.
Initial download of the metrics may take a while.