Fig. A.1
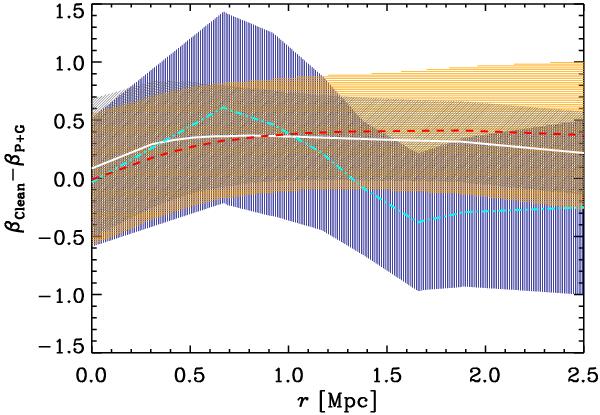
Difference of the β(r) determined using the Clean and P+G samples of members. The solid (white), dashed (red), and dash-dotted (cyan) curves are for all, passive, and SF galaxies, respectively. 1σ intervals on the differences are shown as shaded regions, with 45, 0, and 90 degrees orientation of the (gray, orange, blue) shading for all, passive, and SF galaxies, respectively.
Current usage metrics show cumulative count of Article Views (full-text article views including HTML views, PDF and ePub downloads, according to the available data) and Abstracts Views on Vision4Press platform.
Data correspond to usage on the plateform after 2015. The current usage metrics is available 48-96 hours after online publication and is updated daily on week days.
Initial download of the metrics may take a while.