Fig. 18
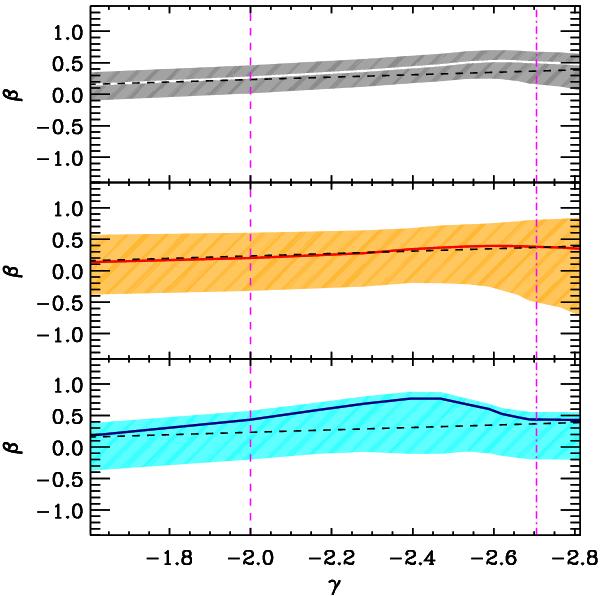
Relations between β(r) and the logarithmic derivative of the total mass density profile, γ(r), for all, passive, and SF member galaxies (top, middle, and bottom panel, respectively), within 1σ confidence regions (shaded regions), and the theoretical γ − β relation of Hansen & Moore (2006) (dashed line). The vertical lines indicate the location of r-2 (dashed) and r200 (dash-dotted).
Current usage metrics show cumulative count of Article Views (full-text article views including HTML views, PDF and ePub downloads, according to the available data) and Abstracts Views on Vision4Press platform.
Data correspond to usage on the plateform after 2015. The current usage metrics is available 48-96 hours after online publication and is updated daily on week days.
Initial download of the metrics may take a while.