Fig. 16
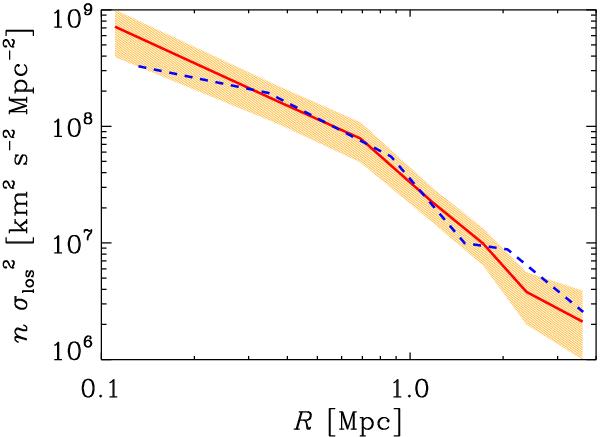
Consistency of the shapes of the  profiles of the passive (solid red line) and SF (dashed blue line) cluster galaxy
populations. The profile for the SF galaxy population has been multiplied by 3.7 to
allow for a direct comparison with the profile of the passive galaxy population. The
hatched (orange) region indicates the 1σ confidence level of the
profile of the passive population (that for the SF population is not shown, but it is
much larger).
profiles of the passive (solid red line) and SF (dashed blue line) cluster galaxy
populations. The profile for the SF galaxy population has been multiplied by 3.7 to
allow for a direct comparison with the profile of the passive galaxy population. The
hatched (orange) region indicates the 1σ confidence level of the
profile of the passive population (that for the SF population is not shown, but it is
much larger).
Current usage metrics show cumulative count of Article Views (full-text article views including HTML views, PDF and ePub downloads, according to the available data) and Abstracts Views on Vision4Press platform.
Data correspond to usage on the plateform after 2015. The current usage metrics is available 48-96 hours after online publication and is updated daily on week days.
Initial download of the metrics may take a while.