Fig. 15
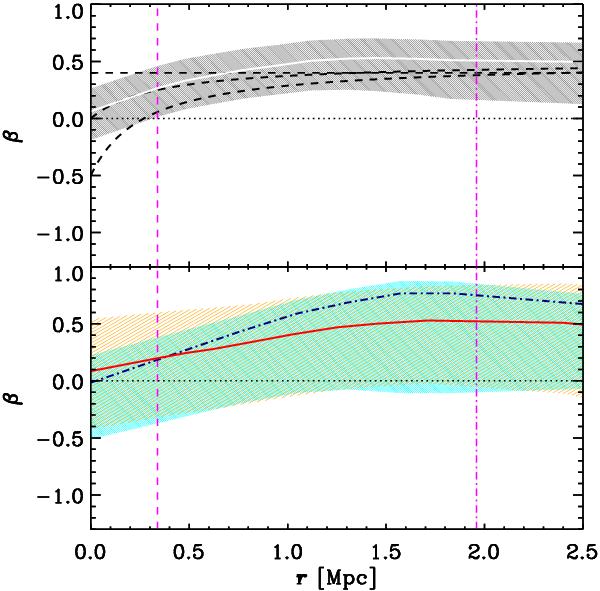
Velocity-anisotropy profile, β(r), of different cluster galaxy populations. Top panel: all cluster members. The solid (white) curve is the solution of the inversion of the Jeans equation adopting the reference mass profile defined in Sect. 3.3. The hatched (gray) region indicates the 1σ confidence region around this solution. For comparison, three β(r) models are shown (black curves). They correspond to the best-fit β(r) models of the MAMPOSSt analysis for a NFW M(r) model (see Sect. 3.1), namely (from top to bottom at small radii) the C, T, and O model. In both panels, the vertical dashed and dash-dotted (magenta) lines indicate the location of r-2 and r200, respectively, and the horizontal dotted line indicates β = 0. Bottom panel: passive and SF cluster members, separately. The red solid (resp. blue dash-dotted) curve and orange (resp. cyan) hatched region represent the solution of the inversion of the Jeans equation within the 1σ confidence region for passive (resp. SF) cluster members.
Current usage metrics show cumulative count of Article Views (full-text article views including HTML views, PDF and ePub downloads, according to the available data) and Abstracts Views on Vision4Press platform.
Data correspond to usage on the plateform after 2015. The current usage metrics is available 48-96 hours after online publication and is updated daily on week days.
Initial download of the metrics may take a while.