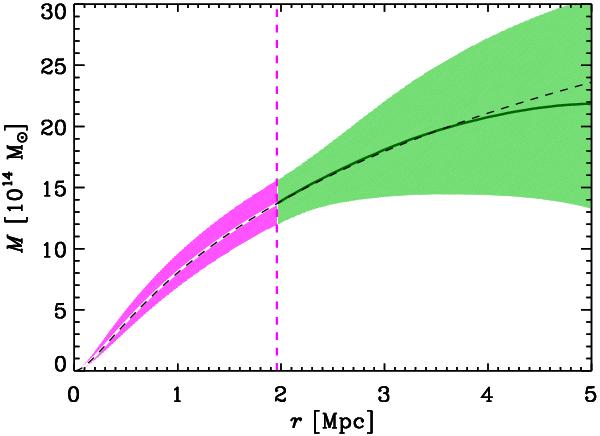
Fig. 14

The solid (white and green) curve and hatched (magenta and green) region represent our fiducial M(r) within 1σ confidence levels. This corresponds to the NFW best-fit to the lensing mass profile of U12 (white curve within magenta region) out to r200,U (indicated by a vertical dashed line), and to the Caustic non parametric mass profile (green curve within light green region) beyond that radius. The dashed black curve represents the NFW best-fit solution obtained by the combined MAMPOSSt+Caustic analysis.
Current usage metrics show cumulative count of Article Views (full-text article views including HTML views, PDF and ePub downloads, according to the available data) and Abstracts Views on Vision4Press platform.
Data correspond to usage on the plateform after 2015. The current usage metrics is available 48-96 hours after online publication and is updated daily on week days.
Initial download of the metrics may take a while.


