Fig. 13
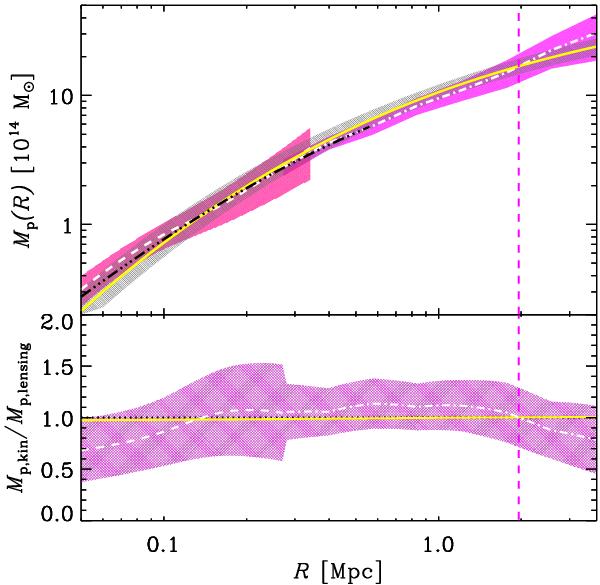
Top panel: the projected mass profile Mp(R) from the joint MAMPOSSt+Caustic pNFW solution (solid yellow line) within 1σ confidence region (hatched gray region), and from the lensing analysis of U12 (dashed white line: strong lensing analysis; dash-dotted line: weak lensing analysis, after subtraction of the contribution of the large-scale structure along the line-of-sight) within 1σ confidence region (hatched magenta regions). The black triple-dots-dashed line is the pNFW mass profile from U12’s analysis of Chandra data. The vertical dashed line indicates the location of r200,U in both panels. Bottom panel: the ratio between the kinematic and lensing determinations of Mp(R). The white dashed and dash-dotted (resp. solid yellow) line represents the ratio obtained using the non parametric determination (resp. the pNFW parametrization) of the lensing Mp(R). The pink hatched region represents the confidence region of this ratio for the non parametric Mp(R) lensing solution. The horizontal black dotted line indicates the value of unity.
Current usage metrics show cumulative count of Article Views (full-text article views including HTML views, PDF and ePub downloads, according to the available data) and Abstracts Views on Vision4Press platform.
Data correspond to usage on the plateform after 2015. The current usage metrics is available 48-96 hours after online publication and is updated daily on week days.
Initial download of the metrics may take a while.