Fig. 1
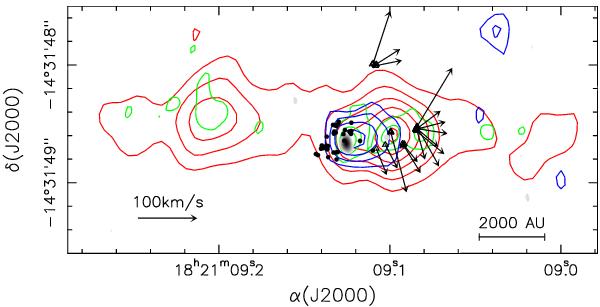
Overlay of the radio continuum emission toward the HMC in G16.59−0.05 at 6 cm (red contours), 2 cm (green), 1.3 cm B-array (blue), and 1.3 cm A-array (gray scale). The contour levels range, respectively, from 0.0264 to 0.1584 in steps of 0.0264 mJy beam-1, from 0.03 to 0.09 in steps of 0.03 mJy beam-1, from 0.174 to 0.348 in steps of 0.058 mJy beam-1, and from 0.075 to 0.25 in steps of 0.025 mJy beam-1. The solid circles and empty triangles represent, respectively, the CH3OH and H2O masers from S2010, while the arrows are the proper motions of the H2O masers. The scale for the proper motion amplitude is given on the bottom left of the panel. The size of the VLA beams for the different array configurations and wavelengths are reported in Table 1.
Current usage metrics show cumulative count of Article Views (full-text article views including HTML views, PDF and ePub downloads, according to the available data) and Abstracts Views on Vision4Press platform.
Data correspond to usage on the plateform after 2015. The current usage metrics is available 48-96 hours after online publication and is updated daily on week days.
Initial download of the metrics may take a while.