Fig. 2
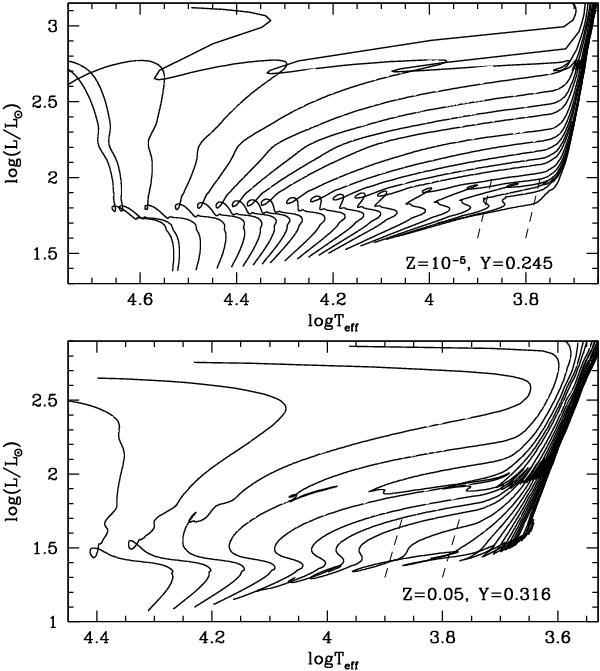
Upper panel: evolutionary tracks for selected HB models with a 0.8 M⊙ RGB progenitor with scaled solar Z = 10-5, Y = 0.245. From left to right the tracks are for masses M/M⊙ 0.517,0.518, and 0.520, then in steps of 0.005 M⊙ up to 0.55 M⊙, in steps of 0.01 M⊙ up to 0.6 M⊙, in steps of 0.02 M⊙ up to 0.7 M⊙, and then ΔM = 0.1 M⊙ up to 0.8 M⊙. The approximate positions of the blue and red boundaries of the RR Lyrae instability strip are also displayed as thin dashed lines. Lower panel: as in the upper panel, but for Z = 0.05, Y = 0.316, and a RGB progenitor with mass equal to 1 M⊙. The less massive HB model has a mass equal to 0.465 M⊙. The mass steps are as in the upper panel, but for masses larger than 0.6 M⊙, where ΔM = 0.1 M⊙.
Current usage metrics show cumulative count of Article Views (full-text article views including HTML views, PDF and ePub downloads, according to the available data) and Abstracts Views on Vision4Press platform.
Data correspond to usage on the plateform after 2015. The current usage metrics is available 48-96 hours after online publication and is updated daily on week days.
Initial download of the metrics may take a while.