Fig. 12
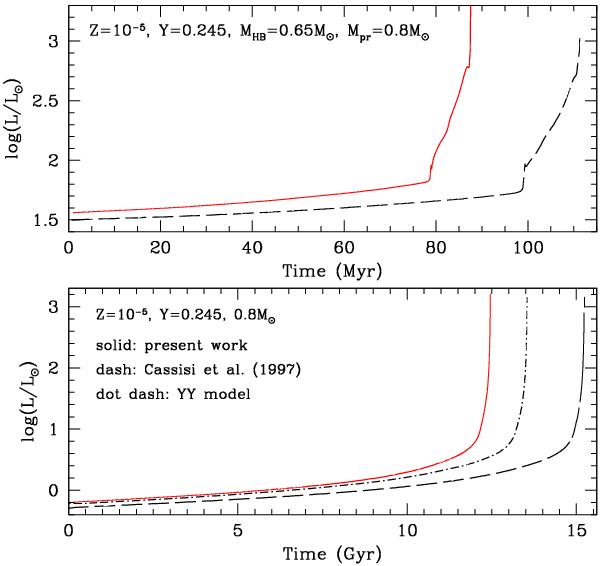
Upper panel: behaviour of the surface luminosity as a function of time for two HB models with the same mass (see labels). The solid line corresponds to our computations, while the dashed line displays results by Cassisi et al. (1997). Lower panel: as in the upper panel, but for 0.8 M⊙ calculations from the zero age MS to the RGB tip, also including a YY model.
Current usage metrics show cumulative count of Article Views (full-text article views including HTML views, PDF and ePub downloads, according to the available data) and Abstracts Views on Vision4Press platform.
Data correspond to usage on the plateform after 2015. The current usage metrics is available 48-96 hours after online publication and is updated daily on week days.
Initial download of the metrics may take a while.