Fig. 9
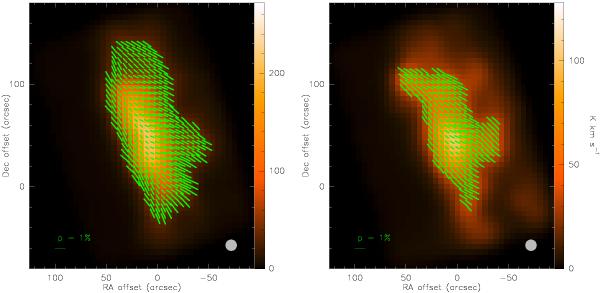
Polarization maps of CO (J = 2 → 1) spectral lines in the blue-shifted (left) and red-shifted (right) wings after the conversion of the circular polarization levels into linear and re-calculation of the polarization vectors. Similar to Figs. 3 and 4, only polarization vectors with p ≥ 3σp are plotted. The beam size for each map is shown in the lower right corners and the offsets are with respect to the reference coordinates  , δ (J2000) = + 22°39′36″.
Current usage metrics show cumulative count of Article Views (full-text article views including HTML views, PDF and ePub downloads, according to the available data) and Abstracts Views on Vision4Press platform.
Data correspond to usage on the plateform after 2015. The current usage metrics is available 48-96 hours after online publication and is updated daily on week days.
Initial download of the metrics may take a while.