Fig. 8
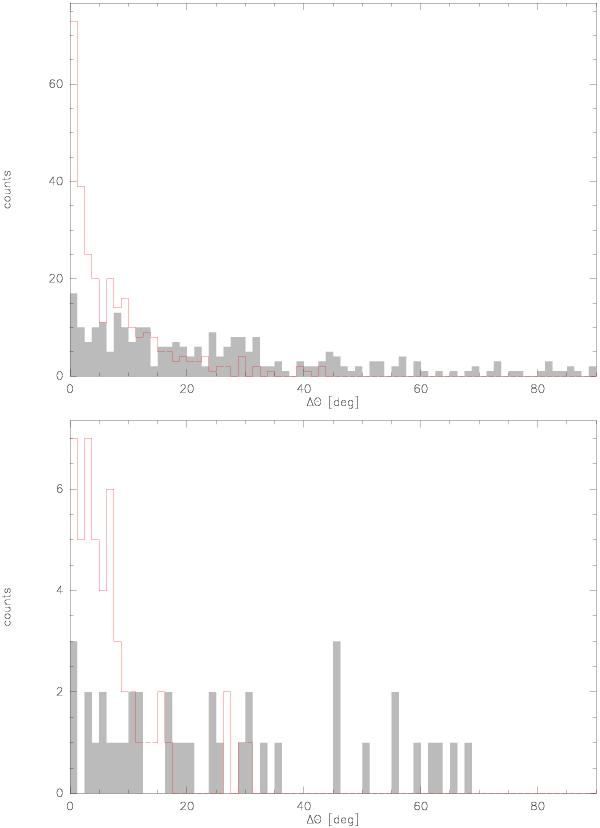
Top: histograms showing the difference between the polarization angles of dust and CO (J = 2 → 1) maps. The grey histogram is a result of comparing the polarization map in Fig. 3 (left) with that of Fig. 7. In the red histogram the Stokes V-corrected CO (J = 2 → 1) polarization map of Fig. 9 is compared to the dust polarization map. The clear alignment of the polarization vectors of the two different tracers in the red histogram is strong evidence for a conversion of linear to circular polarization. Bottom: similar histograms for the comparison of the polarization vectors of dust and CO (J = 1 → 0) maps.
Current usage metrics show cumulative count of Article Views (full-text article views including HTML views, PDF and ePub downloads, according to the available data) and Abstracts Views on Vision4Press platform.
Data correspond to usage on the plateform after 2015. The current usage metrics is available 48-96 hours after online publication and is updated daily on week days.
Initial download of the metrics may take a while.