Fig. 5
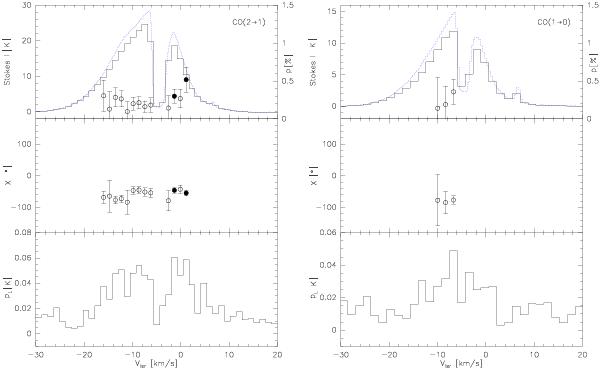
Linear polarization profiles for 12CO (J = 2 → 1) (left) and (J = 1 → 0) (right). The top panels show Stokes I spectra at the peak position of 12CO emission in IC 443-G, i.e., at offsets (20′′, 60′′) from the map origin ( , δ (J2000) = + 22°39′36″), overlaid with fractional linear polarization levels p smoothed to 1.2 km s-1 and 1.4 km s-1, respectively. The dashed profiles are Stokes I at the original resolution of 0.2 km s-1 and 0.4 km s-1 for the higher and lower transitions, respectively. The corresponding polarization angles (χ) are plotted in the middle panel and the linear polarization (
 ) intensity profiles across the spectral line in the bottom. These spectra are corrected for instrumental polarization but not for positive bias due to noise.
Current usage metrics show cumulative count of Article Views (full-text article views including HTML views, PDF and ePub downloads, according to the available data) and Abstracts Views on Vision4Press platform.
Data correspond to usage on the plateform after 2015. The current usage metrics is available 48-96 hours after online publication and is updated daily on week days.
Initial download of the metrics may take a while.