Free Access
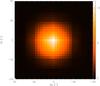
Fig. 2
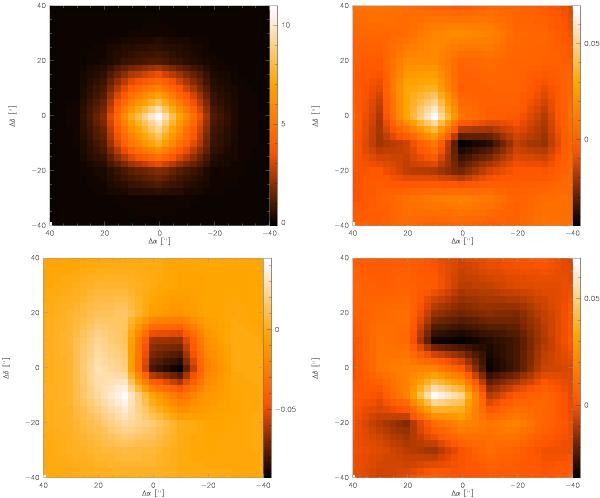
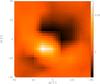
Same order of maps as in Fig. 1 are the intensity maps of Mercury in Stokes I, Q, U, and V at 3 mm. These maps are also over-sampled by a factor of 4 for better display.
This figure is made of several images, please see below:
Current usage metrics show cumulative count of Article Views (full-text article views including HTML views, PDF and ePub downloads, according to the available data) and Abstracts Views on Vision4Press platform.
Data correspond to usage on the plateform after 2015. The current usage metrics is available 48-96 hours after online publication and is updated daily on week days.
Initial download of the metrics may take a while.