Fig. 5
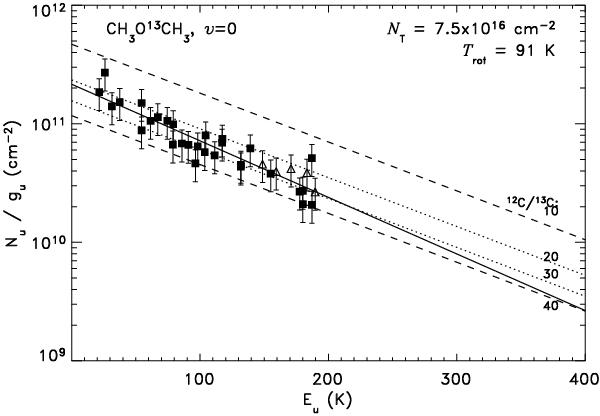
Rotational diagram for CH3O13CH3 corrected for the optical depth. The data has been corrected for the dust optical depth, as well as the modeled line emission from other species. The filled squares (■) represent transitions detected with SHeFI in the 230, 290, and 345 GHz windows, and the open triangles (△) indicate CHAMP+ data. The solid line shows the fit to the combined SHeFI and CHAMP+ data, the dotted lines the fit to the main isotopologue by Bisschop et al. (2013) corrected for a 12C/13C ratio of 20 and 30, and the dashed lines a 12C/13C ratio of 10 and 40.
Current usage metrics show cumulative count of Article Views (full-text article views including HTML views, PDF and ePub downloads, according to the available data) and Abstracts Views on Vision4Press platform.
Data correspond to usage on the plateform after 2015. The current usage metrics is available 48-96 hours after online publication and is updated daily on week days.
Initial download of the metrics may take a while.