Fig. 4
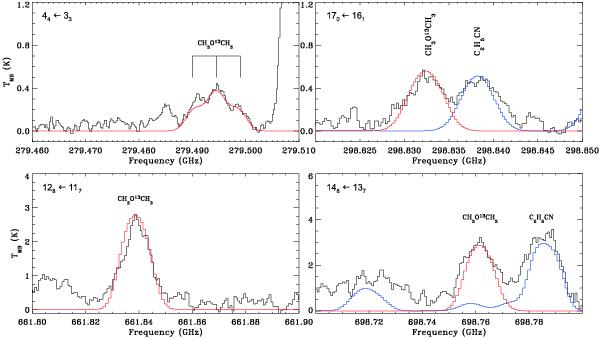
Detail of the APEX line survey towards the hot core G327.3-0.6. The observed spectrum is depicted in black, and the model for 12CH3O13CH3 is overplotted in red. The general model including transitions of all previously identified molecules is given in blue. The spectroscopic assignment of transitions of DME-13C1 is given in the upper left of each individual panel. The asymmetry splitting and the torsional splitting of transitions is not resolved in these lines, except for the first panel, in which the torsional splitting into three components is indicated.
Current usage metrics show cumulative count of Article Views (full-text article views including HTML views, PDF and ePub downloads, according to the available data) and Abstracts Views on Vision4Press platform.
Data correspond to usage on the plateform after 2015. The current usage metrics is available 48-96 hours after online publication and is updated daily on week days.
Initial download of the metrics may take a while.