Free Access
Fig. 5
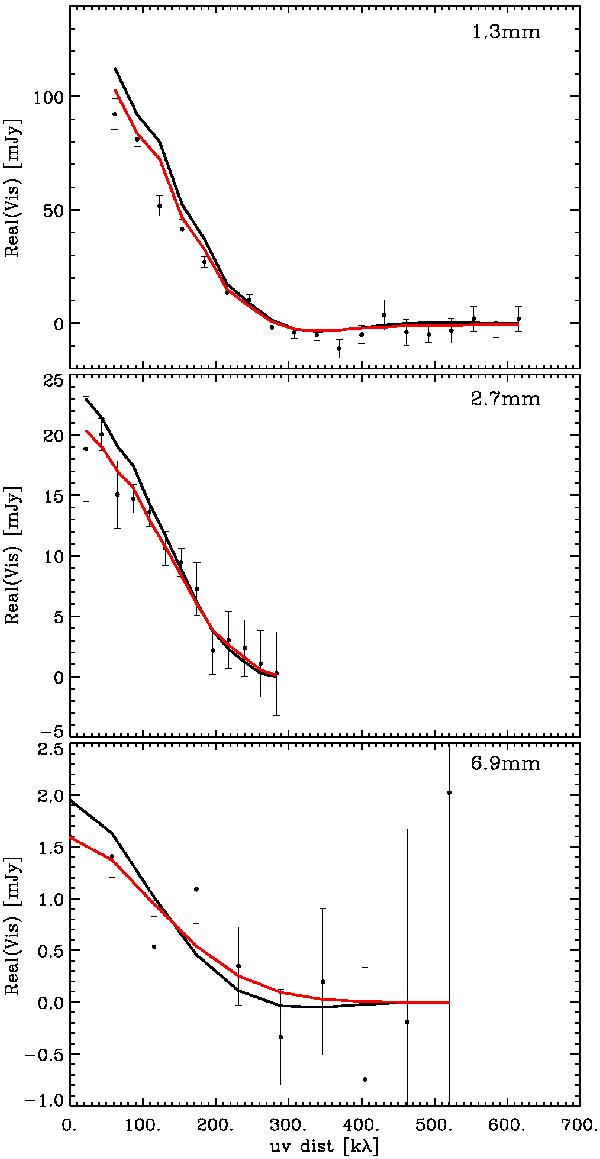
Comparison between the data (dots) and the best-fit model predictions (solid lines) of the real part of the interferometric visibilities as a function of deprojected baseline length. The solid lines show the predicted visibilities for the best-fit model (red lines) and the best-fit model with bmax = 0 (black line).
Current usage metrics show cumulative count of Article Views (full-text article views including HTML views, PDF and ePub downloads, according to the available data) and Abstracts Views on Vision4Press platform.
Data correspond to usage on the plateform after 2015. The current usage metrics is available 48-96 hours after online publication and is updated daily on week days.
Initial download of the metrics may take a while.