Free Access
Fig. 9
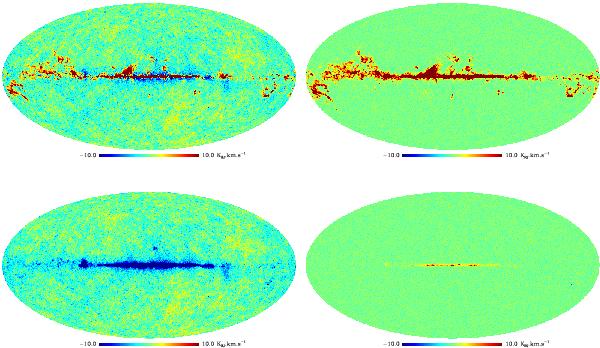
Reconstructed CO emission map (top) and residuals (bottom) for the CO-adapted ILC algorithm (left) and for MILCA (right). The maps are presented at a resolution of 30 arcmin to reduce the noise contribution in the maps.
This figure is made of several images, please see below:
Current usage metrics show cumulative count of Article Views (full-text article views including HTML views, PDF and ePub downloads, according to the available data) and Abstracts Views on Vision4Press platform.
Data correspond to usage on the plateform after 2015. The current usage metrics is available 48-96 hours after online publication and is updated daily on week days.
Initial download of the metrics may take a while.