Fig. 8
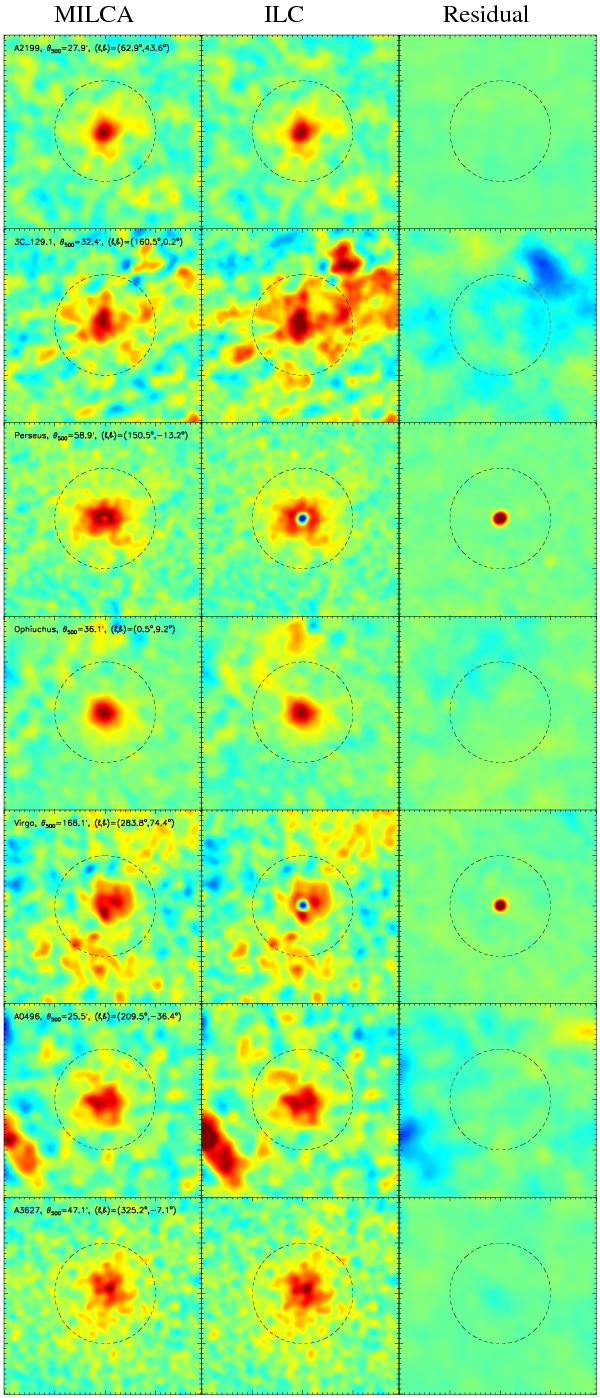
From left to right: tSZ reconstructed y-map with MILCA from Planck public data, with a tSZ effect adapted standard ILC and the difference between the 2 reconstructions. Each row represents the reconstructions for a particular cluster in a FOV of 4 × R500, with the dashed circle representing the R500 aperture. For each cluster the three maps are displayed with the same color scale. All maps are presented at a resolution of 7.18’ FWHM except the Virgo maps at 30’ FWHM.
Current usage metrics show cumulative count of Article Views (full-text article views including HTML views, PDF and ePub downloads, according to the available data) and Abstracts Views on Vision4Press platform.
Data correspond to usage on the plateform after 2015. The current usage metrics is available 48-96 hours after online publication and is updated daily on week days.
Initial download of the metrics may take a while.